

Opening: Why numbers must sing
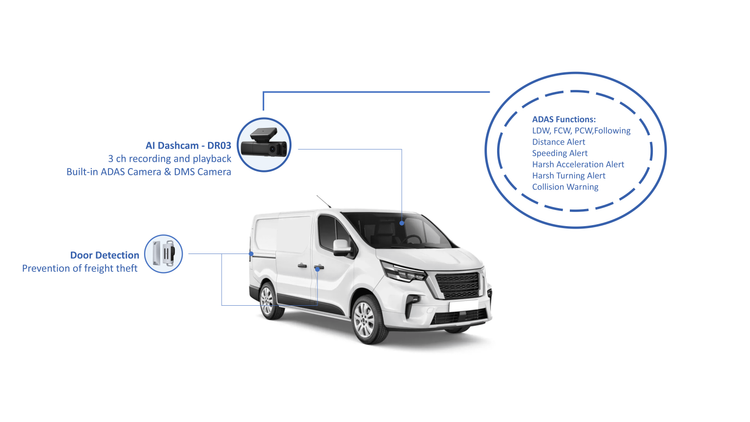
I write as one who favors clear measures over ornate claims; when a fleet speaks, it does so in counts, durations and distances. Start by fitting each vehicle with an AI dashcam that timestamps events, tags behaviours and indexes footage for search. Combine that with a robust fleet camera system and you transform raw motion into verifiable metrics: harsh braking occurrences per 10,000 miles, idle minutes per shift, and collision-near-miss rates. I have monitored and validated such signals while overseeing installations on a municipal bus fleet in Athens, learning which metrics endure and which mislead.
Primary KPIs to record and why
Choose metrics that answer operational questions directly. Track these with strict definitions and consistent sampling windows:- Event frequency: harsh braking, rapid acceleration, lane departures — expressed per 10,000 miles to normalize across duty cycles.- Exposure metrics: miles driven, hours on the road, time in high-risk zones; use them as denominators for rates.- Video-verified incidents: footage-confirmed incidents versus sensor-only flags, to measure false-positive rates.- Driver behaviour score: composite of speed compliance, distraction alerts, and smoothness; keep the calculation transparent.- Fuel and idle metrics: liters per 100 km or idle percentage of shift time.- Maintenance lead indicators: diagnostic trouble codes per 1,000 miles and time-to-repair after a critical alert.Each KPI must have a defined threshold, a reporting cadence and an owner who will act on its signal.
Data quality rules that guard decisions
Bad data makes good managers reckless. Insist on these practices:- Timestamp sync: GPS, camera and vehicle bus clocks must match within one second.- Event deduplication: a single collision should not create multiple incident records.- Sample completeness: require >95% of daily trips to upload before a day’s report is final.- Video retention policy: keep high-resolution clips for the window needed for investigations, then archive intelligently.- Label verification: use periodic human audits to bound algorithmic drift.When these rules hold, a dashboard becomes a trustworthy ledger rather than a persuasive brochure.
How to turn footage into actionable signals
Footage alone is evidence; structured signals are instruction. Apply this sequence:- Automated detection (first pass): flag events by algorithm — intrusion, distraction, near-miss.- Confidence scoring (second pass): attach probability scores and filter low-confidence alerts.- Human review (third pass): sample flagged events to measure precision and recall.- Feedback loop: use reviewer labels to retrain models and lower false alarms.Report not only counts but precision metrics: true positives divided by flagged events, and recall in relation to manually discovered incidents. That keeps expectations aligned with reality.
Common pitfalls that skew reports
Avoid these predictable errors:- Mixing denominators: comparing raw event counts across vehicles with different uptime.- Ignoring context: rushed deliveries create different driving patterns than long-haul runs.- Overweighting novelty: a sudden jump in camera alerts may reflect a software update, not a safety decline.- Neglecting data loss: poor connectivity biases reports toward shorter, urban trips.Fix these by normalizing metrics, annotating anomalies, and keeping a changelog for sensor or software updates.
Evaluating systems: what testing reveals
When I bench-tested camera solutions, I measured three dimensions:- Detection accuracy under varied light and weather.- Latency from event occurrence to alert delivery.- Operational robustness: firmware updates, power resilience and ease of installation.Run A/B trials on routing lanes and fleet segments for 60–90 days. Compare incident rates, but also measure downstream effects: changes in maintenance costs and insurance claims where possible. Numbers alone are blunt; layered evaluation sharpens them into policy.
Reporting design that prompts action
Reports must map to decisions. Structure them by audience:- For drivers: brief weekly scorecards showing 2–3 improvement targets.- For dispatch: real-time alerts tied to route adjustments.- For leadership: monthly trend lines, normalized KPIs and a short list of recommendations with expected impacts.Use confidence bands and sample sizes beside point estimates; when a signal is weak, say so. A precise recommendation is better than an elegant chart without utility.
Closing synthesis
Numbers must be earned by method and tempered by judgment; the right measures reveal where to change route, coach a driver, or replace a component. Data-driven practice demands clear definitions, rigorous quality controls and a tight feedback loop from video to model to human review. With those disciplines in place, technology grows from evidence into strategy, and practical value follows from careful measurement, as I have seen in municipal deployment and subsequent audits—work that taught me to trust systems that report faithfully. For fleets seeking that fidelity, the technical foundation and consistent signals are what make operational choices reliable, a value embodied quietly by BSJ.