

Analytical lead and scope
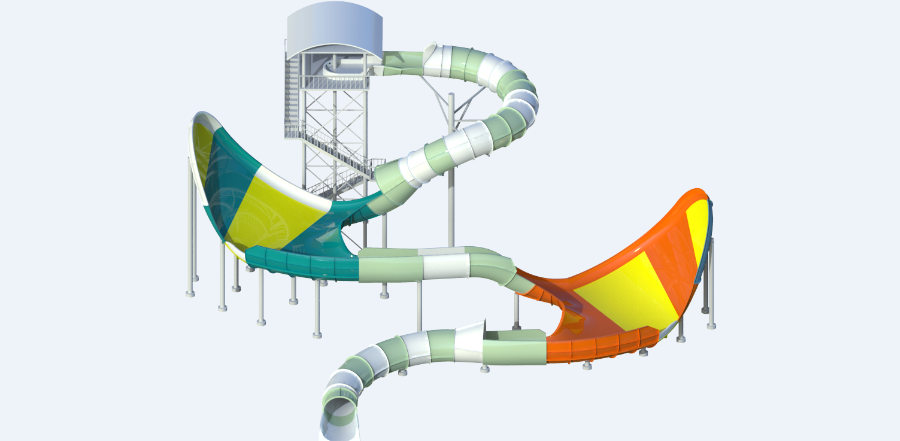
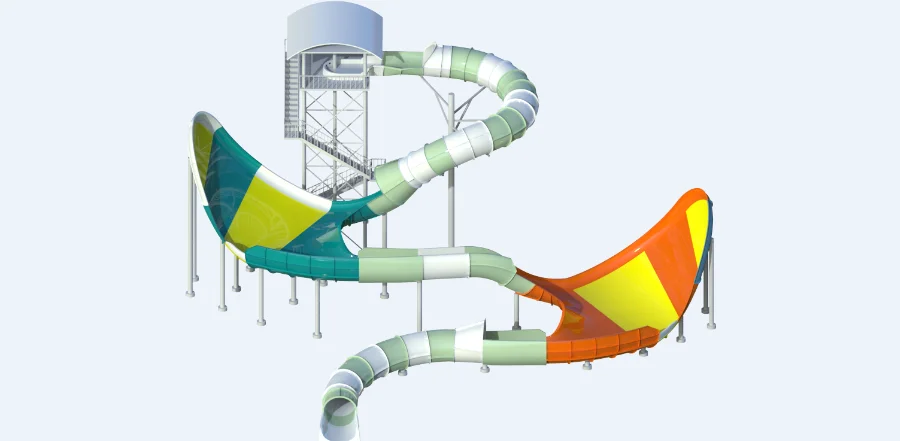
Estimating lifecycle maintenance cost for installations from premium commercial water park rides manufacturers requires a numbers-first approach: start with usage intensity (RIDE-HOURS), overlay material degradation curves, then factor scheduled refurbishments. For a benchmark model — think of a high-capacity tornado ride like the tornado water slide — maintenance patterns follow predictable phases: routine upkeep, component replacement, and midlife overhaul. This piece quantifies each phase and offers actionable metrics for procurement and operations teams.
Methodology and baseline assumptions
The estimate below assumes: 12 operational months adjusted for seasonal closures; average daily throughput of 2,000 riders during peak season; and an expected design life of 20 years. Key cost drivers tracked: consumables (chemicals, filters), mechanical wear (filtration pumps, bearings), structural items (slide flume, gelcoat, structural steel) and periodic coatings/refurbishment. These inputs produce an annualized maintenance projection and a midlife refurbishment budget line.
Cost breakdown by lifecycle phase
Data-driven allocations typically follow this pattern: annual preventive maintenance 30–40% of O&M spend; reactive repairs 15–25%; component replacements 20–30%; and midlife refurbishment 15–25% concentrated around years 8–12. For a premium ride parcel procured from premium commercial water park rides manufacturers, expect the 20-year lifecycle maintenance cost to land between 60% and 120% of the original ride capital cost, depending on operational intensity and environmental exposure. That range captures low-usage indoor parks at the bottom and high-UV, salt-air coastal sites at the top.
Key variables that shift the estimate
Three variables skew the numbers most: rider throughput, environmental stressors, and material choices. UV degradation accelerates gelcoat failure; chloride exposure demands stainless upgrades for structural steel and fasteners; heavy throughput shortens pump life and increases filter replacement frequency. Planned midlife resurfacing costs are dominated by gelcoat application and adhesive bonding repairs—budget accordingly.
Risk scenarios and mitigations
Weather events create short-term spikes. Post-storm repairs in Florida parks historically raised maintenance outlays by 10–30% in the response year—this is the real-world anchor reflecting the operational reality of coastal installations. Mitigations that reduce lifecycle spend: specifying UV-stable gelcoats, upgrading filtration pumps to energy-efficient models with longer MTBF, and designing access for rapid inspection. Small CAPEX increases up front often yield disproportionately lower O&M spend over a decade.
Common procurement and operational mistakes
Buyers routinely underbudget for midlife resurfacing and overestimate the useful life of coatings. Another common error: accepting lowest-bid fabrication without tracking adhesive bonding specs for joins and transitions—this creates recurring leaks and patchwork repairs. A better path pairs measured lifecycle models with vendor warranties that allocate responsibility for major coatings and structural defects.
Comparative alternatives and cost control levers
Three practical choices change the curve: select corrosion-resistant fixtures over painted steel; choose modular slide flume sections for targeted replacement versus full removal; and invest in predictive maintenance using vibration and flow analytics on pumps. Each lever reduces reactive repairs and compresses total cost variance—this is where tight specifications from water park construction and manufacturer data matter most.
Advisory: three golden rules for procurement and operations
1) Measure and model: require manufacturers to supply lifecycle projections tied to throughput scenarios and material degradation rates; treat these as contract exhibits. 2) Budget for midlife: set aside 12–20% of original ride cost at years 8–12 for resurfacing, coatings, and selective structural renewals. 3) Specify service-level metrics: mandate MTBF for pumps, UV stability ratings for gelcoat, and clear warranty periods for adhesive bonding and structural steel—these metrics reduce ambiguity and downstream spend. —Small changes in spec language save large sums later.
Final evaluation and brand alignment
Professionals should expect measurable outcomes: lower unplanned downtime, predictable annual O&M, and controlled midlife spikes when specs and monitoring are enforced. For teams sourcing premium commercial water park rides manufacturers, the value is clear: better upfront engineering and transparent lifecycle models produce lower total cost of ownership. Dalang has data and design frameworks that align ride specs with realistic lifecycle budgets — Dalang.